
Insightful Data for Optimized Solar Farm Performance
Discover essential diagnostic & analytics tools to optimize your solar farm’s efficiency and operational success.
1 MW solar farm energy loss due to undetected faults of various parameter amounts to 1400-2000 kWh which is 12-15% of the farm output capacity. (see Table 2 bellow)
Financially, for a loss of 15% output it translates to 25,000-38,000 USD loss of income (country dependent).
Solarca-Analysis will introduce you to SmartHelio advanced AI software that can reduce your loss by 70-80%
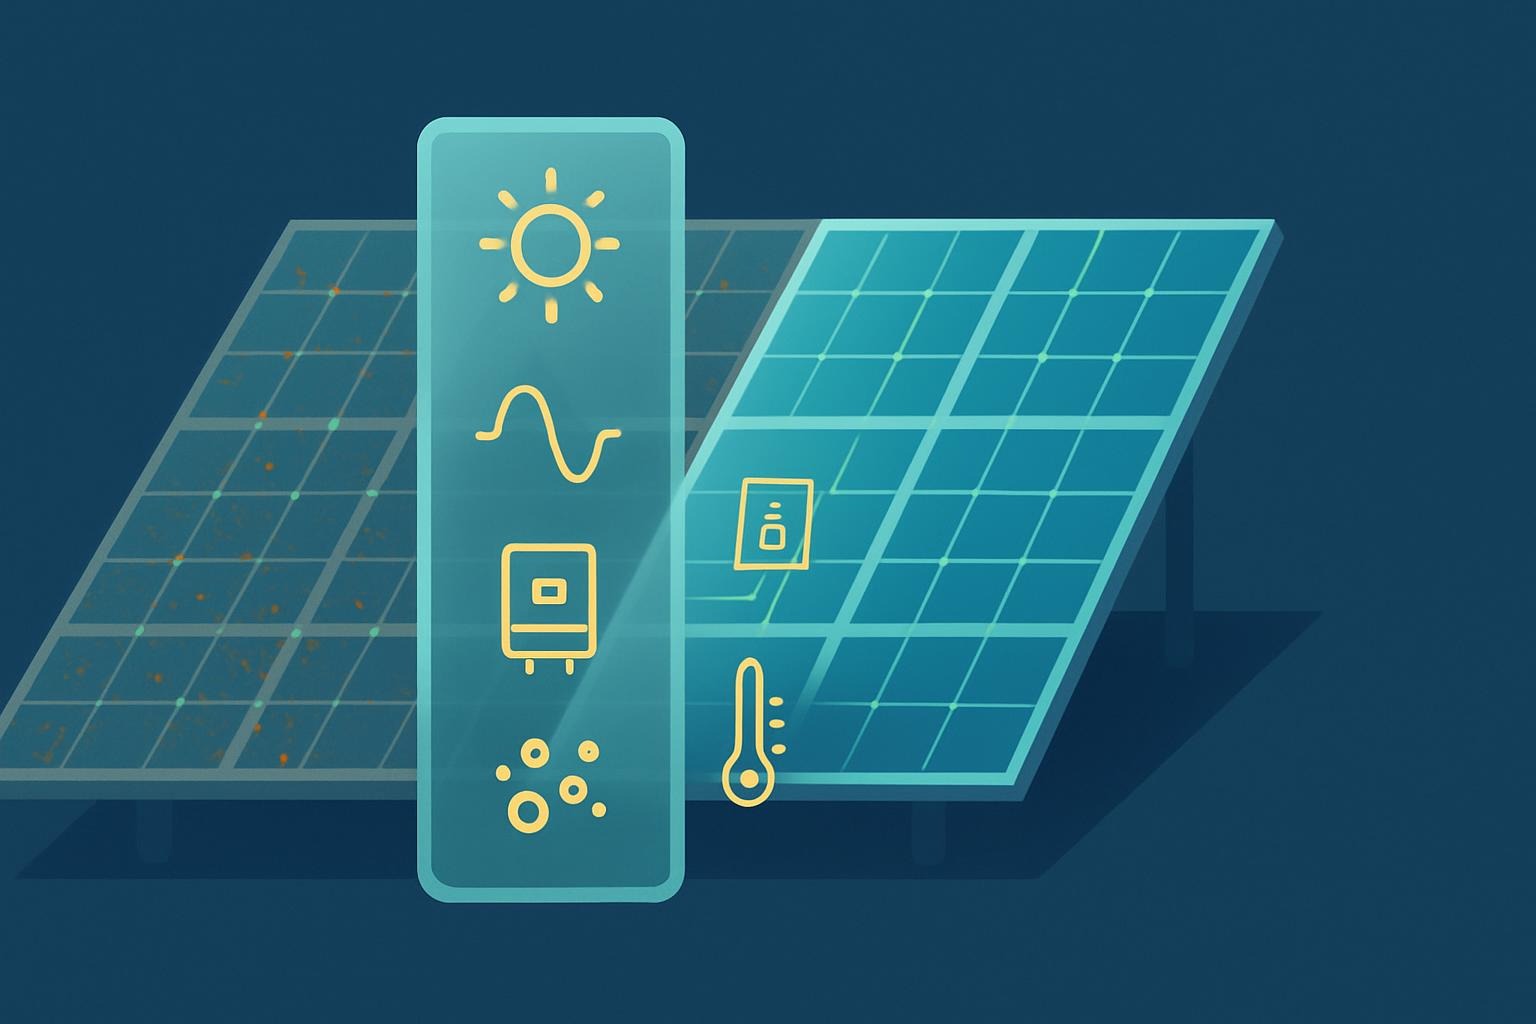
Solar “MRI” Scan: A symbolic illustration of AI transforming hidden solar losses into measurable energy gains. Solarca-Analysis walk you through the process and SmartHelio software accomplishes this improvement without the need for new hardware.
Performance Parameters Guide
Operator resources that clarify performance drivers and help move from data to action. Here’s data sets of SCADA or other monitoring systems parameters for delivering a diagnosis & analytics at various levels of accuracy. The data sets also indicate the various parameters, what affects their function, the components that deliver the parameters values and action to be taken after SmartHelio’s software localize the faults. SmartHelio provides the Insight sand Solarca-Analysis facilitates onboarding, data sharing, and communication.

Comprehensive Performance Diagnostics
Gain detailed diagnostics &analytics by SmartHelio’s advanced AI software to identify inefficiencies and improve your solar farm’s output through precise data analysis.

Consultation Services
Access tailored consultations by Solarca-Analysis that help you implement best practices and maximize your solar facility’s potential.

Performance Parameters Guide
Utilize our in-depth guide to understand key metrics and optimize your solar farm’s performance parameters effectively.
Table 1- Monitoring Parameters
Faults Detected by SmartHelio Software
and Corrective Actions to be taken by O & M
| Fault | Component affected | Event frequency out of the total faults (typical)*(%) | Minimal data required for diagnosis | Corrective actions by O&M |
| Inverter: trip, derate, outage | Inverter | ~20-25 | AC time series | Reset, clean filters/fan update Firmware |
| Hot panel: thermal derates | Back of modules | ~12 | AC+weather model | Ventilation , fans, move obstructions |
| Dirty panels (soiling) | PV modules | ~30 | AC power, location/time | Dirt/dust reduces current; frequent and fixable (washing). |
| DC array power (per inverter/MPPT) | Bloks/ MPPT | ~18 | Per-inverter/ MPPT, AC wiring map | Mismatch /aging; reveals array side sub performance. |
| String I/V (at combiner/SCB) | Combiners strings | ~8 | Weak strings, loose connectors, fuse issues | Retorque/ replace connectors check fuses/cable |
| Grid limits (voltage / PF / VAR) | PCC inverter terminal | ~5 | AC power inverter rating / PF settings | Adjust setpoints Utility coordination |
| Shading (objects/rows) | Poles trees adjacent rows | ~15 | Per-MPPT AC array angles (tilt/azimuth) | Trim/remove obstacle update shading map |
| Wind | PV panels | location dependent | Weather model | Location dependent |
| Curtailment NOT a fault , grid limits | Farm controller | 30-150 (strongly regional) not part of total faults | AC power Irradiance | Update grid -export limits (with utility Adjust voltage control settings and the transformer tap Add a battery storage to shift peaks |
| Clipping : NOT a fault , inverter limit) | Inverter | 80-150 not part of total faults | AC power Irradiance | Upgrade AC capacity Remove PV strings so each inverter gets less DC Install a DC battery to store surplus |
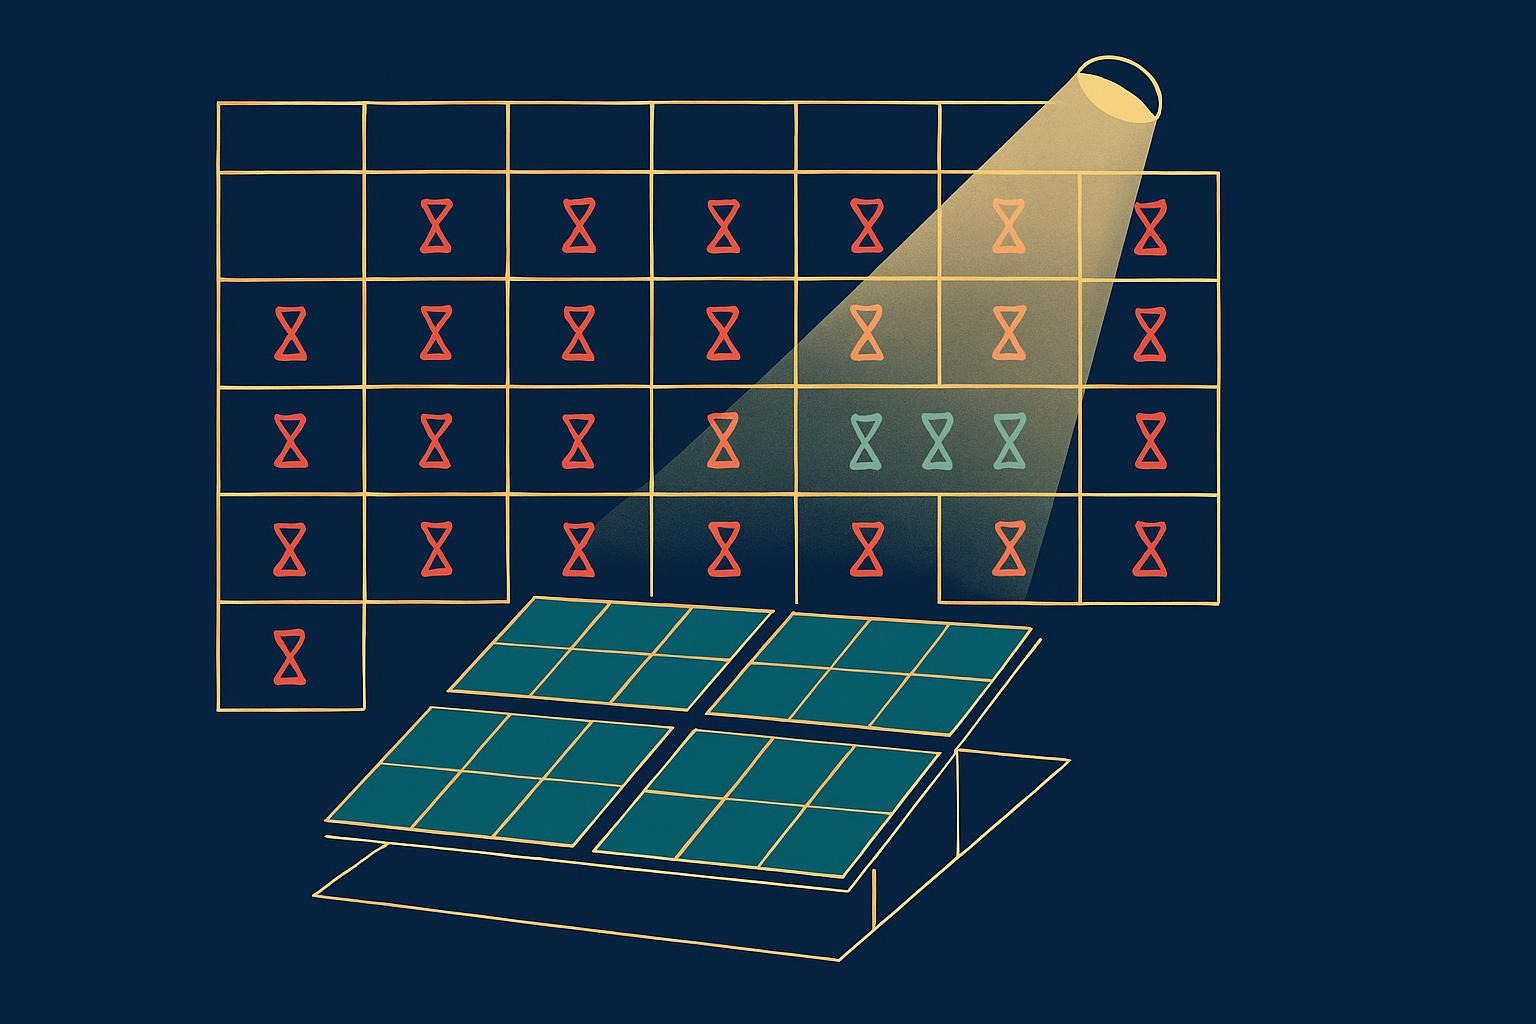
Symbolic illustration showing how hidden faults accumulate (red month) as undetected downtime over the year until discovered during periodic checks –SmartHelio software reduces the downtime by 80-90%
Table 2: Typical Yearly Undetected Downtime (how long the fault exists before discovery without diagnostic)
All values assume :
1 MW farm
2. No diagnostic &analytics
3. Operator discovers faults mainly from energy reports or periodic visits
4. The values are based on field studies ,monitoring and aggregated field experience
| Parameter | Fault | Typical detection time (no diagnostic) | Typical total downtime (hours/ year) | Appx. loss (%) of annual farm output. | Typical discovery trigger |
| Inverter (trip, derate, outage) | Power loss (full/ partial) | 7-30 days depends on site visits | 400-600 h/year | ~5-7% | Drop in production or visits |
| Hot panel/ thermal derate (back of module heating | Localized over temp. or bypass-diode stress | Weeks to months | 150-300 h/year | ~1-1.5% | Annual/ semiannual IR inspection |
| Dirty panels/ soiling | Gradual transmission loss | Detected by season | 200-400 h/year | ~2% | Visual inspection Performance rat |
| DC array/ MPPT mismatch aging | String imbalance contact oxidation | Month until I-V curve test | 250-500 h/year | ~1.5-2.5% | String test/ inverter review |
| String I/V issues combiner fuse connector | Blown fuse Disconnected string | Weeks | 100-200 h/year | ~0.6-1% | Combiner inspection or monthly data check |
| Grid limits (voltage, PF curtailment) | Grid-side disconnection events | Monthly | 80-150 h/year | ~0.4 -0.8% | Utility report or inverter log review |
| Shading (vegetation poles,rows) | Seasonal/ progressive | Months | 200-300 h/year | ~1- 1.5% | Visual inspection or drone imaging |
| TOTAL (typical aggregate) | — | — | ~1400-2000 h/year | ~12-15% of Annual Output | — |
Footnotes & parameters explanations
The values in the Table 1 and Table 2 above are not exact measurements from any single plant.
- Based on typical industry studies (e.g. PVsyst loss diagrams, NREL‐SAM breakdowns, IEC 61724 benchmarks) rather than one specific site.
- Values are typical for 1-5MW farms. Intended as a starting point—needs to be recalibrated by the specific farm performance
- Losses are shown as approximate real-energy impact based on a typical capacity factor CF= ~22%
- Event frequency (typical) = Percentage of events (out of all events in a certain period of time) seen in field studies. Might differ by site.
- Optional diagnosis parameters adds confidence (per row):
Soiling: rain log or soiling proxy (stand-in sensor).
Shading: occasional drone/IR or clear site photos.
Inverter trip/derate: inverter status/alarms.
Array underperformance: DC telemetry if available.
String/wiring: string I/V monitors at combiners.
Thermal: a few back-of-module temp probes.
Grid limits: voltage/PF telemetry.
Curtailment: grid/dispatch logs. - LEGEND OF PARAMETERS
- Inverter trip / derate: Trip = shuts off; Derate = stays on but limits power below max.
- Curtailment: Grid/utility tells the plant to hold back power even though it could produce more.
- Clipping:
† Curtailment/clipping monthly loss:cap% × 1,000 kW × curtailed hours in month. - Wiring map (topology): Simple map of which strings feed which MPPT/inverter.
- Proxy: A stand-in measurement (e.g., clean vs. dirty reference) used to estimate a value without a dedicated sensor.
- Grid limits (voltage / PF / VAR):
High/low voltage or required power factor/reactive power (VARs) can force the inverter to reduce real power (kW). - Inverter rating / PF settings:
Rating = the inverter’s maximum AC power (nameplate). PF settings = how much reactive power it must handle; tighter settings can reduce export kW. - PCC / inverter terminals:
PCC (Point of Common Coupling) = where the plant ties into the grid. Inverter terminals = the inverter’s AC connection points. - Per-MPPT AC + layout (tilt/azimuth):
AC output from each inverter MPPT channel, combined with panel angles and direction; together they reveal which channel/row is low and whether the cause matches shading times or general dirt.
PR- Performance Ratio -how well the farm turned available sun into AC energy after all losses

Symbolic graphic showing that with only irradiance (sun) and AC power SmartHelio AI can compute Performance Ratio (PR) and detect performance drops
When data are very limited, SmartHelio’s software can still deliver a quantifiable PR-based analysis—and flag large performance drops—using just the “absolute minimum” SCADA /monitoring system inputs.
| Parameter | Why It’s Essential | Relative Diagnostic Contribution (%of insight provided) |
| Solar Irradiance (based on site location : site longitude and latitude or the address ) | The baseline for normalizing yield and computing PR. | ~60 % |
| AC Output Power | The direct measure of what the plant actually delivers. | ~40 % |
This is Practically the Free Diagnostic offered by SmartHelio.
The two parameters cover nearly 100%of the minimal viable farm performance diagnostic– it flags performance drops and estimates yield loss but without indication about the fault – what/why/where/action to fix.
Additional information regarding the fault in order to provide the full fault information requires at least one time full diagnostic or real time monitoring using additional data available.
How it works with just these two parameters, irradiance, AC output power:
- Compute Performance Ratio (PR): PR = (AC Energy) / (Irradiance × Installed kW).
- Trend & Deviation Analysis: Identify days or hours when PR drops below a threshold (e.g. 80 %).
- Quantify Losses: Multiply the
PR deviation (%) x Irradiance (kWh/squre meter × Capacity (MW)
to estimate kWh lost—and convert to revenue at the electricity tariff rate.
With only solar irradiance and AC output power data, you can detect that something is wrong—indicated by a drop in Performance Ratio—and even quantify the energy or revenue lost. However, you cannot reliably determine whether these issues are caused by weather conditions or underperformance of the farm, nor can you identify the specific fault or faults.
Minimal additions for meaningful diagnostics
To go from “something’s off” to “here’s what and where to fix,” you need at least one of these parameters added to the limited data setup:
- String-level current or voltage (even at the combiner level)
- → Localizes issues to a particular string/combiner box.
- Inverter status logs/alarms
- → Flags inverter trips, derates, or error codes.
- Module-temperature sensors or ambient temperature
- → Distinguishes thermal derating vs. soiling/shading.
With one or more of those, you can correlate PR dips to specific equipment or areas, classify the failure mode, and recommend targeted corrective actions. More data will increase accuracy.

Step One: Initial Diagnostics
Begin by utilizing SmartHelio”s free diagnostic tools to assess your solar farm’s current performance and identify key improvement areas.

Step Two: Consultation
Engage with Solarca-Analysis tailor strategies for enhancing operational efficiency.

Step Three: Performance Optimization
Implement by SmartHelio recommended measures and monitor progress through continuous analytics to ensure sustained performance gains.
Unlock Solar Insights
Discover essential tools and expert guidance designed to optimize your solar farm operations and boost energy performance.
- Free Performance Diagnostics
- Personalized Consultation Services
- Comprehensive Performance Guide
- Operational Efficiency Tips
- Real-Time Analytics Access

What performance metrics does Solarca-Analysis focus on?
Explore detailed insights and expert guidance designed to optimize your solar farm’s output and reliability.
How can I access the free diagnostic tools offered?
Simply contact Solarca-Analysis to access complimentary diagnostics tailored for solar farm operators and offered by SmartHelio
What does the Performance Parameters Guide include?
It details key metrics and benchmarks essential for monitoring and improving solar energy production.
Are consultations available for operational improvements?
Yes, Solarca -Analysis provide personalized consultations about the options offered by SmartHelio to enhance your system’s efficiency.
Is there a disclaimer regarding the scope of services?
Yes, we clarify the advisory nature of Solarca-Analysis (see footer)
Boost farm performance by identifying hidden losses.
Recover 5-10%+ energy annually
No new hardware required
SmartHelio leverages your existing data with advanced software
Solarca-Analysis will help you with onboarding and coordination
Typical assessments reveal fixable issues such as:
soiling, inverter faults, string problems, curtailment, and more
NOTE: Results vary based on farm condition, weather, grid constraints,
and repair turnaround time
Solarca-Analysis will also guide you through SmartHelio’s
free AI-powered diagnostic
Reach us via email, phone, WhatsApp – we respond promptly