
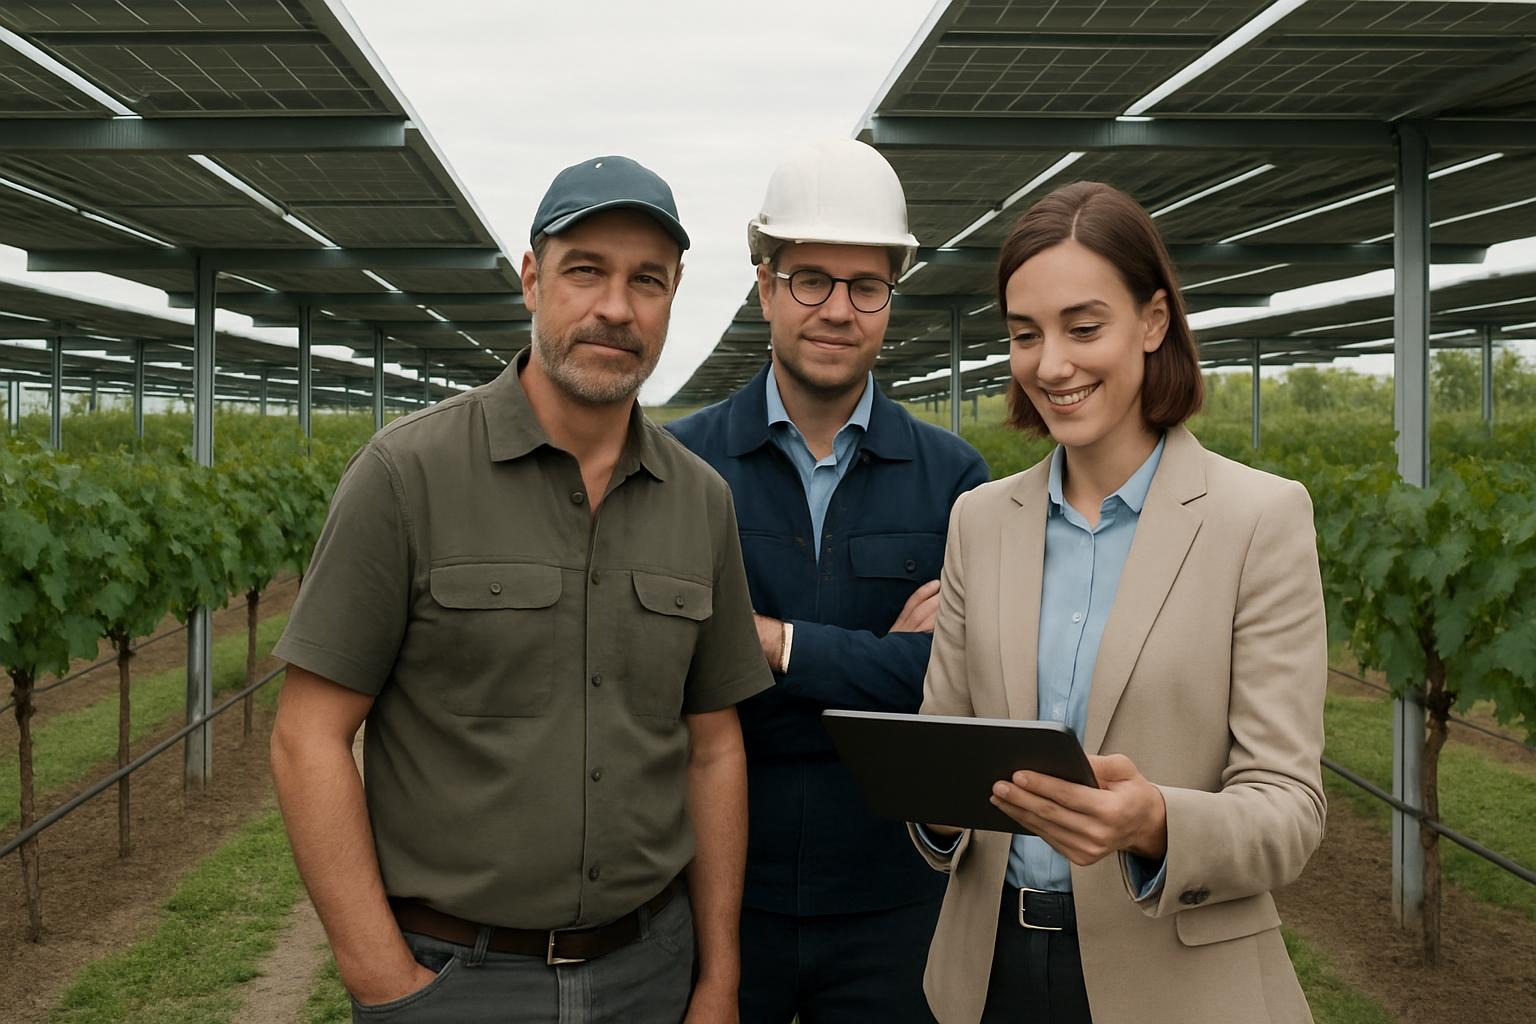
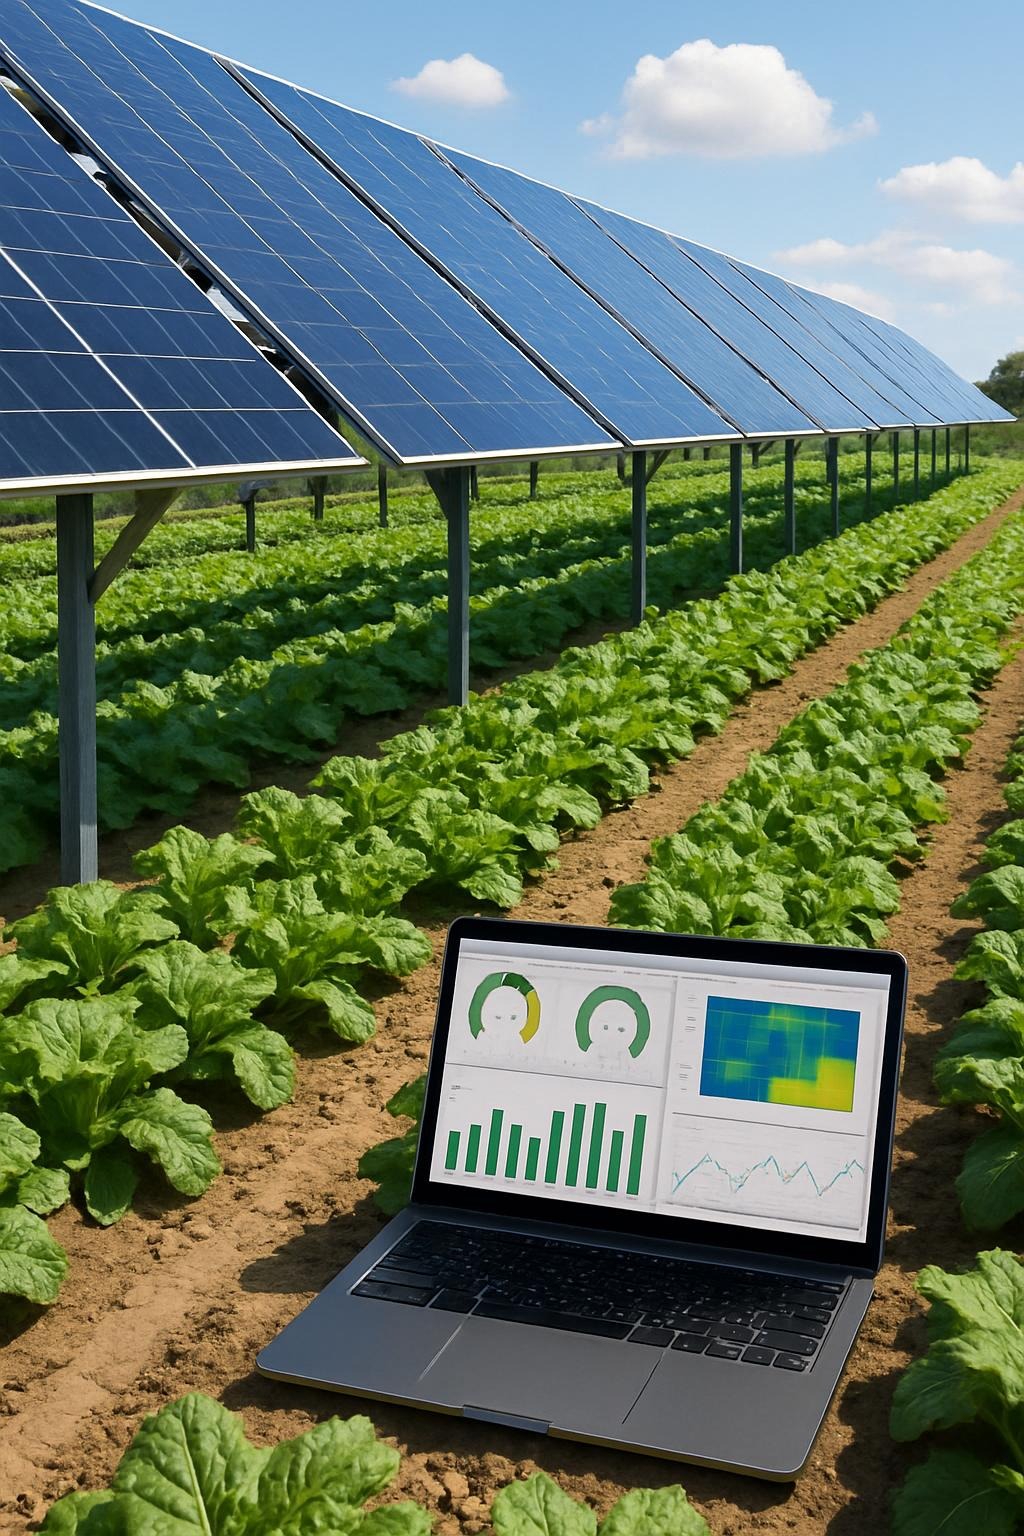
Maximize Efficiency and Agricultural Success
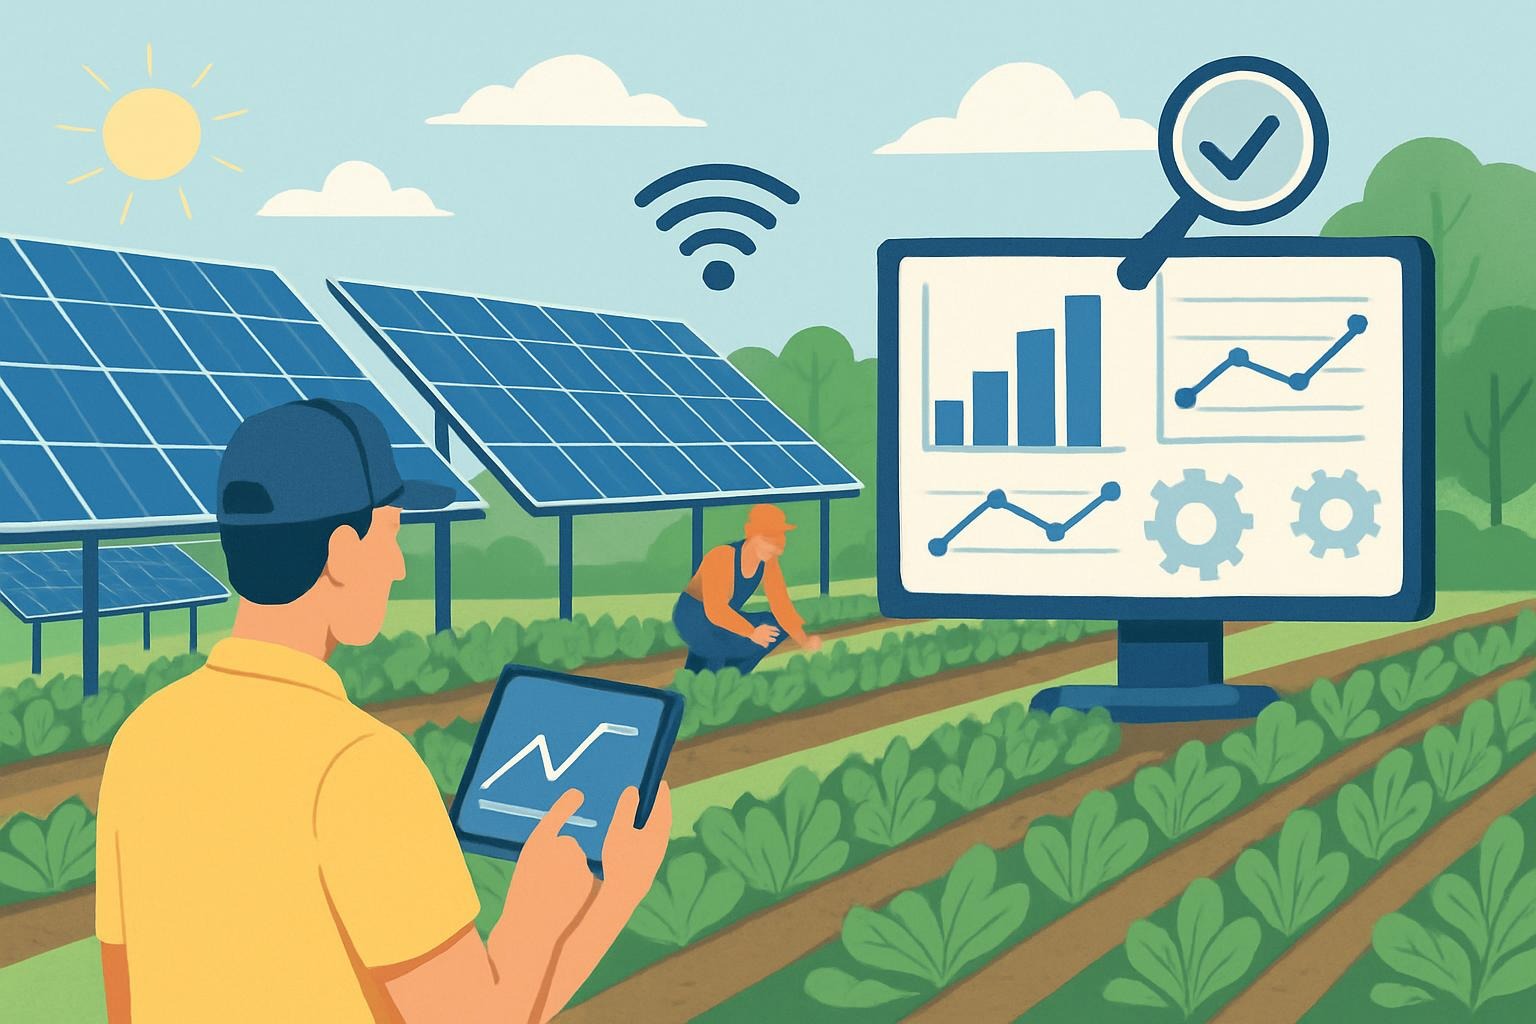
The diagnostic and analytics tools optimize Agrivoltaic farm operations with precision. Solarca-Analysis will support you to link your Agrivoltaic site to SmartHelio’s diagnostics and analytics software. results based on using your existing SCADA or exported data,
No need for extra hardware
Faster fault detection, less downtime, and fewer crop operation disruptions.

Optimized Energy Management
Leverage advanced analytics to ensure seamless solar energy integration, reducing downtime and boosting power output.

Enhanced Crop Performance
Utilize real-time data to fine-tune farming practices, promoting healthier crops alongside solar infrastructure.

Seamless Hardware Integration
Implement our solutions without additional equipment, maintaining farm workflow while maximizing productivity.
Optimizing Agrivoltaic Farm Operations with Precision
Explore key challenges in agrivoltaic farming and discover how our diagnostics enhance efficiency and crop yield seamlessly.
Minimizing Operational Disruptions
Our analytics identify and prevent system interruptions, ensuring continuous energy production and farm productivity.
Enhancing Energy Efficiency
Leverage our data-driven insights to maximize solar panel output without compromising agricultural needs.
Boosting Crop Yield and Health
By integrating advanced monitoring, we help optimize balanced-shade patterns across the field to support healthier , more uniform crops –without adding new hardware.

Discover Our Cutting-Edge Solutions
Unlock optimized agrivoltaic farm performance with our tailored analytics.
Seamless Diagnostics
Real-time insights to minimize disruptions and maintain smooth operations.
Enhanced Energy Efficiency
Maximize solar output while supporting productive agriculture simultaneously.
Hardware-Free Integration
Implement analytics without the need for additional on-site equipment.
Improved Crop Yields
Data-driven strategies to boost agricultural productivity alongside solar energy.
Potential Outcomes for Agrivoltaic Farms
Discover SmartHelio detailed methodology designed to guide Agrivoltaic farm operators in maximizing productivity and energy efficiency effortlessly.
Solarca-Analysis will explain the advantages and connect you with SmartHelio
Operator Benefits at a Glance (WHAT you get)
Legend: AV-only = unique to agrivoltaics · AV-boosted = matters in all PV but more in agrivoltaics
- Legend: AV-only = unique to agrivoltaics · AV-boosted = matters in all PV but more in agrivoltaics
- Detect seasonal shading faster as canopy height and crop cycles change. (AV-only)
- Reduce vegetation- and soiling-driven losses with cleaning/grazing windows based on impact, not guesses. (AV-boosted)
- Cut downtime from tracker misalignment and overly conservative wind-stow settings. (AV-boosted)
- Avoid false alarms by separating grid limits (clipping/curtailment) from crop-induced shading. (AV-only)
- See true performance with microclimate-aware baselines (POA, module/ambient temps, canopy effects). (AV-boosted)
- Protect crops by surfacing thermal-stress and irrigation anomalies early. (AV-only)
- Plan work with ops-aware scheduling that respects harvest, irrigation, and animal access. (AV-only)
SmartHelio: Agrivoltaic-specific insights (HOW it works)
- Dynamic shade fingerprints (row/block): season-aware baselines learn canopy growth and sun path changes to spot mismatch early.
- Vegetation vs. dust disaggregation: separates plant growth losses from soiling to choose grazing/mowing vs washing.
- Tracker anomaly localization: identifies mis-tracking rows, gearbox/actuator issues, and mis-set wind-stow on elevated racking.
- Bifacial/vertical performance control: tracks albedo shifts (soil → canopy) and their effect on back-side gain.
- Irrigation–power coupling: correlates irrigation logs, temperatures, and AC output to flag leaks or over-/under-watering.
- Composite KPIs beyond MWh: operational dashboards for TTD/TTR, Water per MWh, and yield/LER proxies.
- Exception-only alerting: monthly summaries that surface AV-specific anomalies without alarm fatigue.

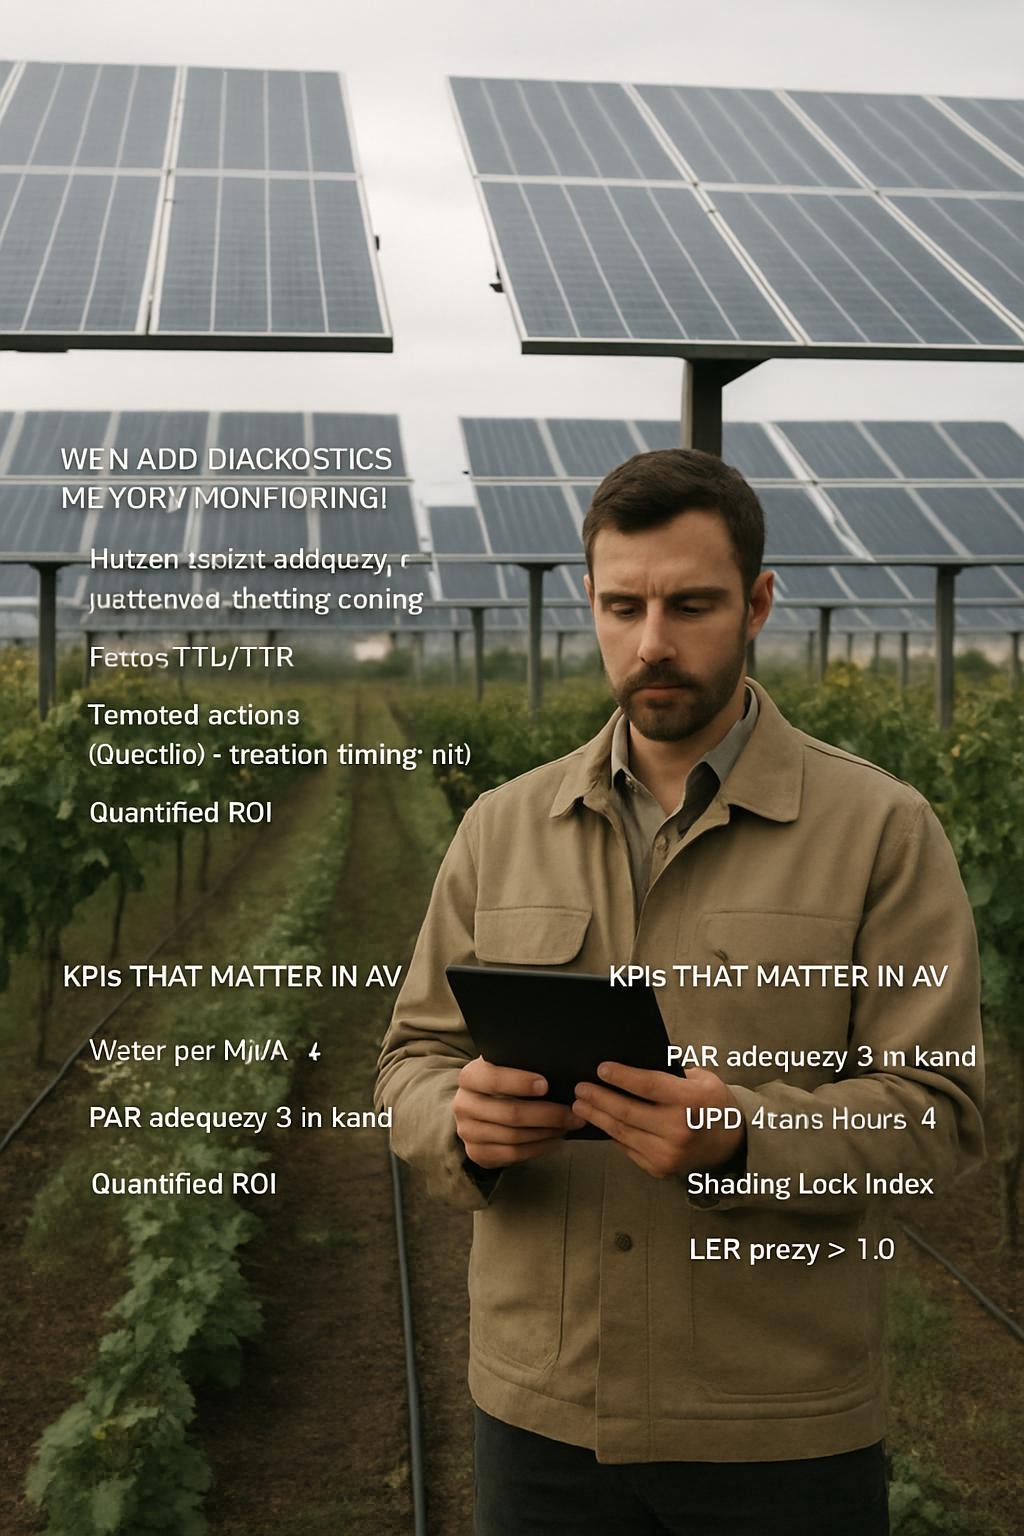
Why add Diagnostics on top of Regular Solar Monitoring (WHY now)
- More variables = more risk: crop cycles, machinery clearance, livestock movement, canopy dynamics, and elevated racking introduce failure modes standard PV doesn’t face.
- Dual objectives: you manage energy and agriculture (yield, water, animal plans); analytics optimizes both—not just MWh.
- Faster recovery, less crop stress: earlier detection shortens time-to-repair and limits agronomic knock-on effects.
- Evidence for stakeholders: data-backed records support investors, insurers, and regulators evaluating dual-use outcomes.
- Confident scale-up: quantify real improvements and residual risks to move from pilot to full acreage with clarity.
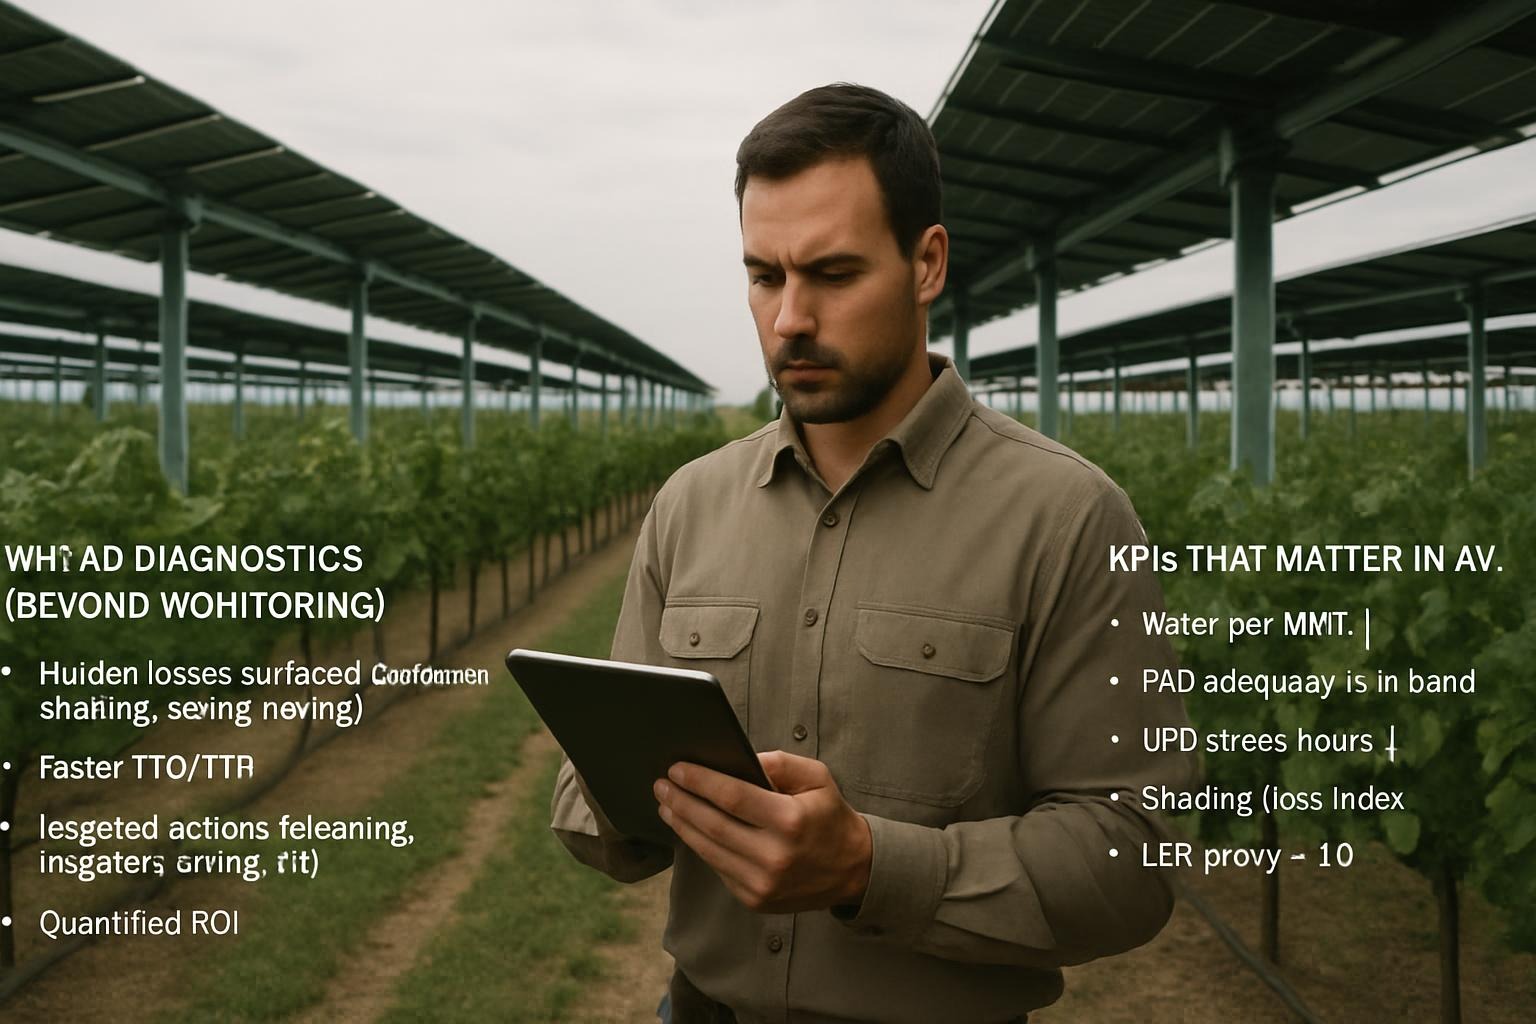
Key Performance Indicators (KPI) beyond MWh
- Time to Detect and Time to Repair — how fast faults are found and fixed; the aim is hours, not days.
Tooltip: Shorter detection/repair cuts both energy loss and crop stress. - Water per MWh — relate irrigation volume to energy produced to spot waste and improve timing of cleaning/grazing.
Tooltip: If water per MWh jumps without a heatwave or crop change, check for leaks or over-watering and adjust schedules. - Land-Equivalent view (Land Equivalent Ratio) — a simple combined look at energy + agriculture so dual-use gains (or trade-offs) are visible.
Tooltip: If the combined score trends down, investigate shading, tracker settings, or agronomic practices before scaling up.
Why KPIs are extra important for agrivoltaics (vs a regular solar farm)
Regular PV focuses on energy only. Agrivoltaics has two missions: energy and agriculture. KPIs tie them together so you don’t optimize one while hurting the other.
Proof for stakeholders: Investors/insurers/ag partners want evidence that dual use is performing as intended.
Dual objectives: You must track both MWh and ag outcomes (water, yield, animal operations).
More moving parts: Crops grow, canopies change, animals move, trackers are elevated—more ways to lose performance if you don’t measure.
Faster recovery matters more: A slow fix can mean crop stress or missed harvest windows, not just lost kWh.
Optimizing Agrivoltaic Farm Performance Through Innovation
How an agrivoltaic farm utilizES diagnostics and analytics to enhance crop yields and energy output seamlessly.
Sustained Growth with Data-Driven Agrivoltaic Solutions
Agrivoltaic operation addressed operational challenges and elevated efficiency through our advanced analytics platform.
Driving Exceptional Results in Agrivoltaic Farming
This case study illustrates how an Agrivoltaic farm diagnostic and analytics improved system reliability and agricultural productivity using our tailored analysis tools.

Optimize Your Agrivoltaic Farm Today
Empower your Agrivoltaic operations with insights that boost efficiency and yield
| Region / Country | Site size (MW) | Crops / Use | Region climate | PV impact after diagnostics | Agri impact after diagnostics | Diagnostic / Analytics angle (clear) | Annual Agri gain (USD, modeled) | Annual energy gain (USD) | O&M savings (USD/yr) | Total annual impact (USD) |
|---|---|---|---|---|---|---|---|---|---|---|
| Europe / Germany (Heggelbach) | 2.0 | Field crops | Temperate | +4.0% (≈154 MWh/yr) | LER > 1.6; yields maintained | Seasonal shade fingerprints; POA-normalized baselines; exception summaries | 800 | 13,090 | 4,000 | 17,890 |
| Europe / France (Amance – TSE canopy) | 2.9 | Field crops | Temperate | +3.0% (≈168 MWh/yr) | −75% days of water stress (season) | Irrigation–power coupling; microclimate flags | 1,160 | 13,608 | 4,000 | 18,768 |
| North America / USA (Arizona trials) | 1.0 | Chiltepin, tomato, jalapeño | Arid | +4.0% (≈77 MWh/yr) | Tomato ↑; jalapeño water loss ↓ | Vegetation vs. soiling disaggregation; harvest-aligned ops | 1,500 | 2,695 | 3,000 | 7,195 |
| Asia / Japan (“solar sharing” rice) | 1.5 | Rice | Humid subtropical | +2.5% (≈72 MWh/yr) | 75–85% of control yields | Angle/transparency tuning vs. yields; exception-only alerts | 300 | 4,392 | 2,000 | 6,692 |
| Middle East / Israel (national pilots) | 3.0 | Mixed crops | Mediterranean–arid | +3.5% (≈202 MWh/yr) | Ops coordinated to limit stress | Soiling-window optimization; tracker anomaly localization | 2,700 | 26,260 | 3,000 | 31,960 |
| Europe / Italy (vineyard / pear pilots) | 1.8 | Grapes, pears | Mediterranean | +3.0% (≈104 MWh/yr) | LER ~1.4; quality maintained | Bifacial/back-side gain control; canopy-albedo tracking | 1,080 | 8,424 | 3,000 | 12,504 |
| Europe / Netherlands (berries AV) | 2.67 | Raspberries, redcurrant | Temperate marine | +2.5% (≈129 MWh/yr) | Quality/condition benefits | Row mis-tracking detection; humidity-aware washing cadence | 2,350 | 10,449 | 3,000 | 15,799 |
| South America / Chile (blueberries) | 3.5 | Blueberries | Mediterranean–semi-arid | +3.0% (≈202 MWh/yr) | Irrigation demand ↓ (microclimate) | Canopy ET anomaly flags; water–power correlation | 5,250 | 33,936 | 3,500 | 42,686 |
| Asia / India (grape farms) | 2.5 | Grapes | Semi-arid tropical | +3.0% (≈145 MWh/yr) | Yields ~95–105% of control | String-level mismatch; row-shading baselines | 2,100 | 3,770 | 2,000 | 7,870 |
| Africa / Morocco (date-palm AV) | 2.0 | Date palm / oasis crops | Hot desert | +3.0% (≈116 MWh/yr) | Irrigation efficiency focus | PV thermal signals; soiling thresholds | 1,800 | 11,136 | 3,000 | 15,936 |
| Africa / South Africa (mixed AV) | 2.8 | Mixed | Semi-arid | +3.0% (≈162 MWh/yr) | Target ≤10% water drop | Multi-parameter AV monitoring; exception summaries | 1,680 | 14,580 | 3,000 | 19,260 |
| Oceania / Australia (solar grazing) | 4.5 | Sheep (vegetation mgmt) | Arid–semi-arid | +2.5% (≈217 MWh/yr) | Vegetation incidents ↓ | Vegetation-encroachment detection; grazing-window optimizer | 2,700 | 12,369 | 5,000 | 20,069 |
| Europe / UK (solar grazing, planned) | 3.0 | Sheep (vegetation mgmt) | Temperate | +2.0% (≈116 MWh/yr) | Mowing events reduced | Vegetation O&M analytics; animal-access scheduling | 1,800 | 9,860 | 3,500 | 15,160 |
| Europe / Spain (berries / greenhouse AV) | 2.2 | Berries | Mediterranean | +2.5% (≈106 MWh/yr) | Yields stabilised after cover tuning | Microclimate thresholds; cover/clipping trade-off alerts | 1,320 | 8,586 | 3,000 | 12,906 |
| South America / Brazil (Minas Gerais pilot) | 2.0 | Mixed | Tropical highland | +3.0% (≈116 MWh/yr) | Yields maintained | Season-aware baselines; KPI panel | 1,200 | 19,257 | 2,500 | 22,957 |
NOTE: Move the arrow at the bottom of the Table to scroll the entire Table
Annual energy gain (USD): uses the recovered MWh from diagnostics (same as Table 1) multiplied by local $/MWh
Annual Agri gain (USD) numbers were computed (conservative)
Area proxy: 1 MW ≈ 2 hectares of dual-use land. Annual Agri gain = (Area × per-hectare gains)
Per-hectare gains = (yield delta × typical crop revenue/ha) + (water savings).
Typical crop revenue/ha (conservative guides): field crops $2k; vegetables $6k; berries $8–10k; grapes $6k; rice $2.5k; date-palm $5k; mixed $3k.
Yield deltas: only applied where trials report likely upside (e.g., AZ veg +5%; NL berries +3%; Chile blueberries +3%; India grapes +2%). Otherwise 0% to avoid over-claiming.
Water savings: valued via simple regional proxies (USD per hectare-year)
Arid/semi-arid: ~$450/ha (e.g., AZ/Israel/Morocco/Chile/Australia).
Mediterranean: ~$300/ha (e.g., Italy/Spain).
Temperate: ~$200/ha (e.g., Germany/France/Netherlands/UK).
Humid (Japan/rice): ~$100/ha.
O&M savings (USD/yr): conservative roll-up of vegetation management (grazing vs mowing) and optimized cleaning.
Boost agrivoltaic performance by finding hidden energy + agronomy losses.
Recover ~2–4% energy annually (up to 6–9% on soiling-prone or mis-tracked sites).
Cut water use ~10–30% (often +20–40% water-use efficiency) and stabilize yields (many field crops ~0–+20%; heat-sensitive crops can gain more under shade).
No new hardware required.
SmartHelio analyzes your existing SCADA/monitoring data with advanced diagnostics & analytics.
Solarca-Analysis handles onboarding, data prep
Typical agrivoltaic assessments uncover fixable issues such as:
• Seasonal canopy-driven shading/mismatch
• Vegetation encroachment (align grazing/mowing)
• Tracker misalignment & wind-stow settings in raised arrays
• Irrigation–power coupling (leaks, over/under-watering)
• Soiling vs. vegetation loss separation
• Distinguishing clipping/curtailment from agronomic shading
NOTE: Actual results vary with crop and shade design, site condition, seasonality, water costs, grid constraints, data quality, and repair turnaround time.